
Dashboard link: https://app.emax-digital.com/rapid-retail-analytics-vendor
Overview
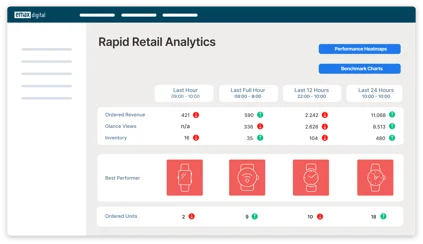
Rapid Retail Analytics (RRA) is emax digital's near-real-time pulse dashboard for Amazon Vendor Central. While most vendor reporting works on daily or weekly cadence, this dashboard tracks performance at hourly resolution across five rolling time windows — Last Hour, Last Full Hour, Last 12 Hours, Last 24 Hours, and Last 48 Hours — so you can detect demand shifts, traffic anomalies, or top/bottom product movements within the same business day.
It is designed for vendor managers, brand managers, and trading teams who need to react quickly: spotting a promotion that is over- or under-performing, catching a sudden drop in conversion, identifying the day's hero product, or seeing whether today is tracking ahead of or behind a normal weekday pattern.
All timestamps on the dashboard are in Central European Time (Europe/Berlin). Ignored catalogue entries (ASINs you have flagged to exclude) are removed from every calculation.
What You Can Answer with Rapid Retail Analytics
Beyond the live numbers, RRA is built to help you act quickly on a handful of recurring questions:
-
Find high-traffic, low-conversion pages — spot detail pages that attract visits but convert poorly, so you can address content, pricing, or Buy Box issues.
-
Gauge deal performance — see which deals are in high demand and which are underperforming while they are still live.
-
Read purchase patterns — identify the times of day your products sell best and pace activity accordingly.
-
Direct traffic where it pays off — decide which deals or ASINs to push for the biggest incremental impact.
What You Can See on This Dashboard
The dashboard is organised top-to-bottom around five time windows shown side-by-side as columns, plus three follow-on sections: today vs. benchmarks, a per-ASIN detail table, and a 48-hour rolling trend block.
Section 1 — Hourly Ordered Units Trend (five windows)
Five line charts across the top of the page, one per time window, each showing the ordered-units trajectory for that window versus its immediate prior window.
-
Last Hour — Current hour vs. previous hour, anchored to the latest available sales snapshot.
-
Last Full Hour — Current hour vs. previous hour, but anchored to the latest available traffic snapshot. This keeps the comparison in sync with the glance views and conversion-rate metrics shown elsewhere, since sales and traffic feeds update at different intervals.
-
Last 12 Hours — Current 12-hour window vs. the prior contiguous 12 hours.
-
Last 24 Hours — Day-over-day comparison: most recent 24 hours vs. the 24 hours before that.
-
Last 48 Hours — Two-day rolling window vs. the prior 48 hours, smoothing out short-term hourly noise.
All five windows are non-overlapping and contiguous with their comparison baseline.
Section 2 — Sales & Traffic KPI Scorecards (five windows)
Below each trend chart, a scorecard block summarises the same time window with the headline KPIs. Available metrics per window:
-
Ordered Units — Total units ordered in the window.
-
Ordered Revenue — Total revenue in the window. Hidden where average price display is restricted by company settings.
-
Glance Views — Total product detail page visits in the window.
-
Conversion Rate — Ordered Units ÷ Glance Views, calculated using traffic-aligned order counts so numerator and denominator cover the same time window.
Important: Amazon does not provide Glance Views or Conversion Rate for the Last Hour window — only the Last Full Hour and longer windows include traffic metrics.
Each metric is shown for both the current window and the prior comparison window, so you can see direction of travel at a glance.
Section 3 — Unique ASINs Sold (five windows)
A scorecard for each time window showing how many distinct ASINs received at least one order. This is a breadth-of-demand signal: is your revenue spread across the catalogue, or concentrating on a few hero products? Each ASIN is counted once per window regardless of order volume.
Section 4 — 🚀 Best Performer (five windows)
For each of the five time windows, the dashboard surfaces the single top-selling ASIN by ordered units, alongside:
-
Ordered units for that ASIN in the window.
-
The product image (from a detail-page snapshot within the last 14 days).
-
The ASIN code.
-
A direct link to the Amazon detail page (opens in a new tab).
Use this row to instantly identify the hero product for any rolling window — the "Last Hour" view is especially useful during live promotions or Prime events.
Section 5 — 📉 Biggest Loser (five windows)
The mirror image of Best Performer: for each time window, the dashboard surfaces the ASIN with the steepest percentage drop in ordered units versus its comparison window. Calculated as (Current − Prior) ÷ Prior. The ASIN with the most negative trend value is shown, together with its product image, ASIN code, and detail-page link.
ASINs with zero units in the prior window are excluded from the calculation to avoid division by zero — so this surfaces products that were selling and have suddenly stopped or slowed sharply, not products that have always had zero sales.
Section 6 — ⌚ Today's Performance vs. Benchmarks
Two side-by-side hourly bar charts comparing today's performance to two benchmark layers, hour by hour.
Hourly Ordered Units — Today vs. Previous 24 Hours vs. 3-Week Benchmark
-
Today — Ordered units for each completed hour of the current day.
-
Previous 24 Hours — Same hour and day-of-week from the prior 24-hour period, aligned by day-of-week so comparisons stay like-for-like across week boundaries.
-
3-Week Benchmark — Average ordered units for the same hour and day-of-week across the previous 3 weeks. This is your seasonal baseline.
Hourly Glance Views — Today vs. Previous 24 Hours vs. 3-Week Benchmark
The same three-series comparison, but for product page traffic. Helps separate genuine visibility changes (e.g. a Deal of the Day) from normal weekly rhythms.
Both charts display up to 24 hourly data points.
Section 7 — 📋 Product (ASIN) Details Table
A per-ASIN breakdown table that pulls together the most operationally useful real-time signals on a single row per product. Ranked by 24-hour ordered units; only ASINs with sales in the last 24 hours are shown.
Columns shown:
-
Product Details — Image · Title · SKU · ASIN · direct detail-page link.
-
Sales (24H and 1H) — Ordered Units and Ordered Revenue for both the last 24 hours and the most recent hour individually. Revenue is hidden where average price display is restricted.
-
Traffic & Conversion (24H and 1H) — Glance Views and Conversion Rate for both windows, calculated on traffic-aligned data.
-
Inventory Health — Highly Available Inventory units, an estimated Run-Out Date (based on the 24-hour sales rate), and a colour-coded Inventory Alarm: red = will run out within 2 days or already at zero; yellow = no recent sales to estimate from; green = sufficient stock.
This table is the workhorse for daily check-ins — sort it however you need and it gives you sales, traffic, conversion, and stock-out risk all in one place.
Section 8 — 📊 Performance Last 48 Hours
Two line charts giving the full hourly trend over the most recent 48 hours, with all filters applied.
-
Ordered Units vs. Ordered Revenue — Both series plotted by hour, useful for spotting price-mix effects (e.g. units up but revenue flat = lower-priced products selling).
-
Glance Views vs. Conversion Rate — Traffic volume against conversion percentage by hour, to see whether shifts in revenue are traffic-driven or conversion-driven.
Available Filters
|
Filter |
What it does |
Multi-select? |
Default |
|---|---|---|---|
|
Marketplace |
Restrict the view to a single Amazon marketplace (e.g. DE, UK, FR, IT, ES) |
No |
— |
|
Category |
Filter to one or more of your product categories |
Yes |
All categories |
|
Subcategory |
Filter to one or more sub-categories within the selected Category |
Yes |
All subcategories |
|
Product (ASIN) |
Filter to one or more specific ASINs |
Yes |
All ASINs |
|
Tag |
Filter ASINs by manually assigned product tags |
Yes |
All tags |
|
Auto Tag |
Filter ASINs by automatically assigned tags (e.g. lifecycle, growth bucket) |
Yes |
All auto tags |
Filter interaction notes
-
Subcategory depends on Category. Selecting one or more Categories narrows the Subcategory list to values that belong to those Categories.
-
Marketplace is single-select. This dashboard shows one marketplace at a time — you cannot aggregate across DE + FR in a single view. To compare marketplaces, run the dashboard once per market.
-
All filters apply consistently across every section of the dashboard, including the Best Performer / Biggest Loser ranking logic — i.e. the "top ASIN" is the top ASIN within your filtered set.
Use Cases
1 — Live promotion monitoring (Prime Day, Black Friday, brand campaigns)
You have a deal running and need to know whether it is working right now.
-
Open the dashboard at the start of the promotion and refresh every 10–15 minutes.
-
Read the Last Hour and Last Full Hour scorecards for ordered units and revenue.
-
Use the Today vs. Benchmarks chart to confirm today's hourly curve is beating the 3-week baseline for the same weekday.
-
Check the Best Performer row to see which ASIN is driving the spike; check the Biggest Loser row to spot any product whose deal is not converting as hoped.
2 — Morning check-in / "is everything healthy?"
A fast 30-second daily ritual before your stand-up.
-
Read the five Last 24 Hours scorecards: Ordered Units, Revenue, Glance Views, Conversion Rate.
-
Compare the 24H number to the prior 24H baseline shown alongside.
-
Scroll to the Today vs. Previous 24H vs. 3-Week Benchmark chart — if today's bars are tracking below the 3-week line for several consecutive hours, escalate.
-
Glance at the Inventory Alarm column in the ASIN table for any red flags.
3 — Sudden conversion drop investigation
You notice the Last 12 Hours conversion rate is well below the Last 48 Hours rate.
-
Confirm whether the drop is traffic-driven (Glance Views also down) or conversion-driven (Glance Views flat or up, but Ordered Units down).
-
Drop into the ASIN detail table, sort by Glance Views 24H descending, and compare each top product's Conversion Rate 1H vs. 24H — that isolates which ASINs are dragging the conversion average down.
-
Check the Biggest Loser row for the 12-hour window to identify the steepest-declining individual ASIN, then click through to its Amazon detail page to look for Buy Box loss, out-of-stock variations, or pricing changes.
4 — Stock-out early warning
You want to make sure no fast-mover runs out before the next PO arrives.
-
Go to the ASIN detail table and scan the Inventory Status column for red flags.
-
For each red row, check the Ordered Units 24H column to confirm sales velocity, and the Run-Out Date to see exact timing.
-
Cross-reference with the Best Performer rows — your top sellers are also your top stock-out risks during demand spikes.
5 — Spotting demand for a normally quiet ASIN
Useful when an ASIN suddenly appears in the Best Performer row that you weren't expecting.
-
Note the ASIN from the Best Performer row.
-
Apply the Product filter to that single ASIN.
-
Use the Performance Last 48 Hours charts to see when the spike began and whether it's traffic-led (an ad campaign? influencer mention?) or conversion-led (a competitor stock-out shifting demand to you).
Limitations & Notes
-
Vendor Central only. This dashboard covers vendor (1P) hourly sales and traffic. Seller Central (3P) data is not included.
-
Single marketplace at a time. The Marketplace filter is single-select; multi-market roll-ups are not supported on this dashboard.
-
Glance Views and Conversion Rate are unavailable for the Last Hour. Amazon does not publish traffic data with that granularity in real time. The dashboard flags this with an inline note. Use Last Full Hour instead — it is traffic-anchored and gives you a complete sales + traffic picture for the most recent fully reported hour.
-
Sales and traffic feeds update on different schedules. The dashboard handles this by computing the "current" reference timestamp separately for sales and traffic. As a result, the timestamp shown for the Last Hour (sales-anchored) may be one hour ahead of the Last Full Hour (traffic-anchored).
-
All times in CET (Europe/Berlin). Even for non-EU marketplaces, the dashboard's hour boundaries follow Berlin time. Bear this in mind when comparing against, for example, UK-localised promotion start times.
-
Revenue may be hidden. Where company settings restrict average price display, all revenue-based fields (Ordered Revenue, Ordered Revenue 1H/24H) will be blank. Unit figures and traffic metrics remain unaffected.
-
Biggest Loser excludes new-zero ASINs. ASINs that had zero orders in the comparison window are excluded from the trend calculation to avoid divide-by-zero. This means a product going from "0 → some sales" cannot appear, but the calculation correctly highlights real declines from a non-zero baseline.
-
3-Week Benchmark needs three weeks of history. For newly added ASINs or recently launched marketplaces, the benchmark line in the Today's Performance chart may be incomplete or zero.
-
Product images are cached. Images come from detail-page snapshots within the last 14 days. Very recent listing changes (new main image) may take up to two weeks to appear here.
-
Ignored catalogue entries excluded. ASINs flagged as ignored in your catalogue settings are excluded from every figure, including the rankings.
Data Refresh
The dashboard refreshes approximately every 10 minutes, pulling the latest available hourly snapshots from Amazon's near-real-time vendor sales and traffic feeds. Note that Amazon's own publishing cadence is the upper bound on freshness — sales data typically lands within 1–2 hours of an order being placed, and traffic data slightly later.