
The Seller Hub contains all dashboards for Amazon Seller Central (3P) brands. It covers weekly and monthly performance summaries, ASIN-level analysis, inventory, FBA returns, portfolio health, and cross-period comparisons.
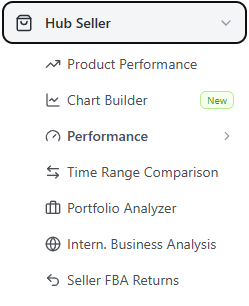
Dashboards in This Section
📒 Product Performance (Seller)
A customizable ASIN-level table combining Seller Central retail and advertising data. Build your own views, sort and filter by category or tag, and save presets for fast repeat access.
Chart Builder (Seller) (coming soon)
Create and save your own chart views for reporting and presentations.
📈 Performance — Seller
Your weekly and monthly business summary for Seller Central. Covers Sales and Units, Margin, Visibility, Brand Summary, Traffic Diagnostic, and Inventory — each with its own drill-down dashboard for deeper analysis.
⏱️ Time Range Comparison (Seller)
Compare any two date ranges side by side at daily resolution — retail and advertising performance aligned day-by-day regardless of calendar dates. Use it for event comparisons, before/after analysis, or campaign-flight comparisons.
📒 Portfolio Analyzer (Seller)
Classifies every product in your Seller catalogue into Star, Quick Buy, Shelf Warmer, or Question Mark based on relative traffic and conversion performance. Seven traffic-light alarms highlight the products most in need of attention.
🌎 International Business Analysis (Seller)
Cross-marketplace performance overview for Seller brands operating in multiple Amazon markets. View sales, traffic, and margin trends side by side across all your active marketplaces.
♻️ Seller FBA Returns
Analyze FBA return volumes, return rates, and reasons across your Seller catalogue. Identify products with high return rates and the categories most affected.