
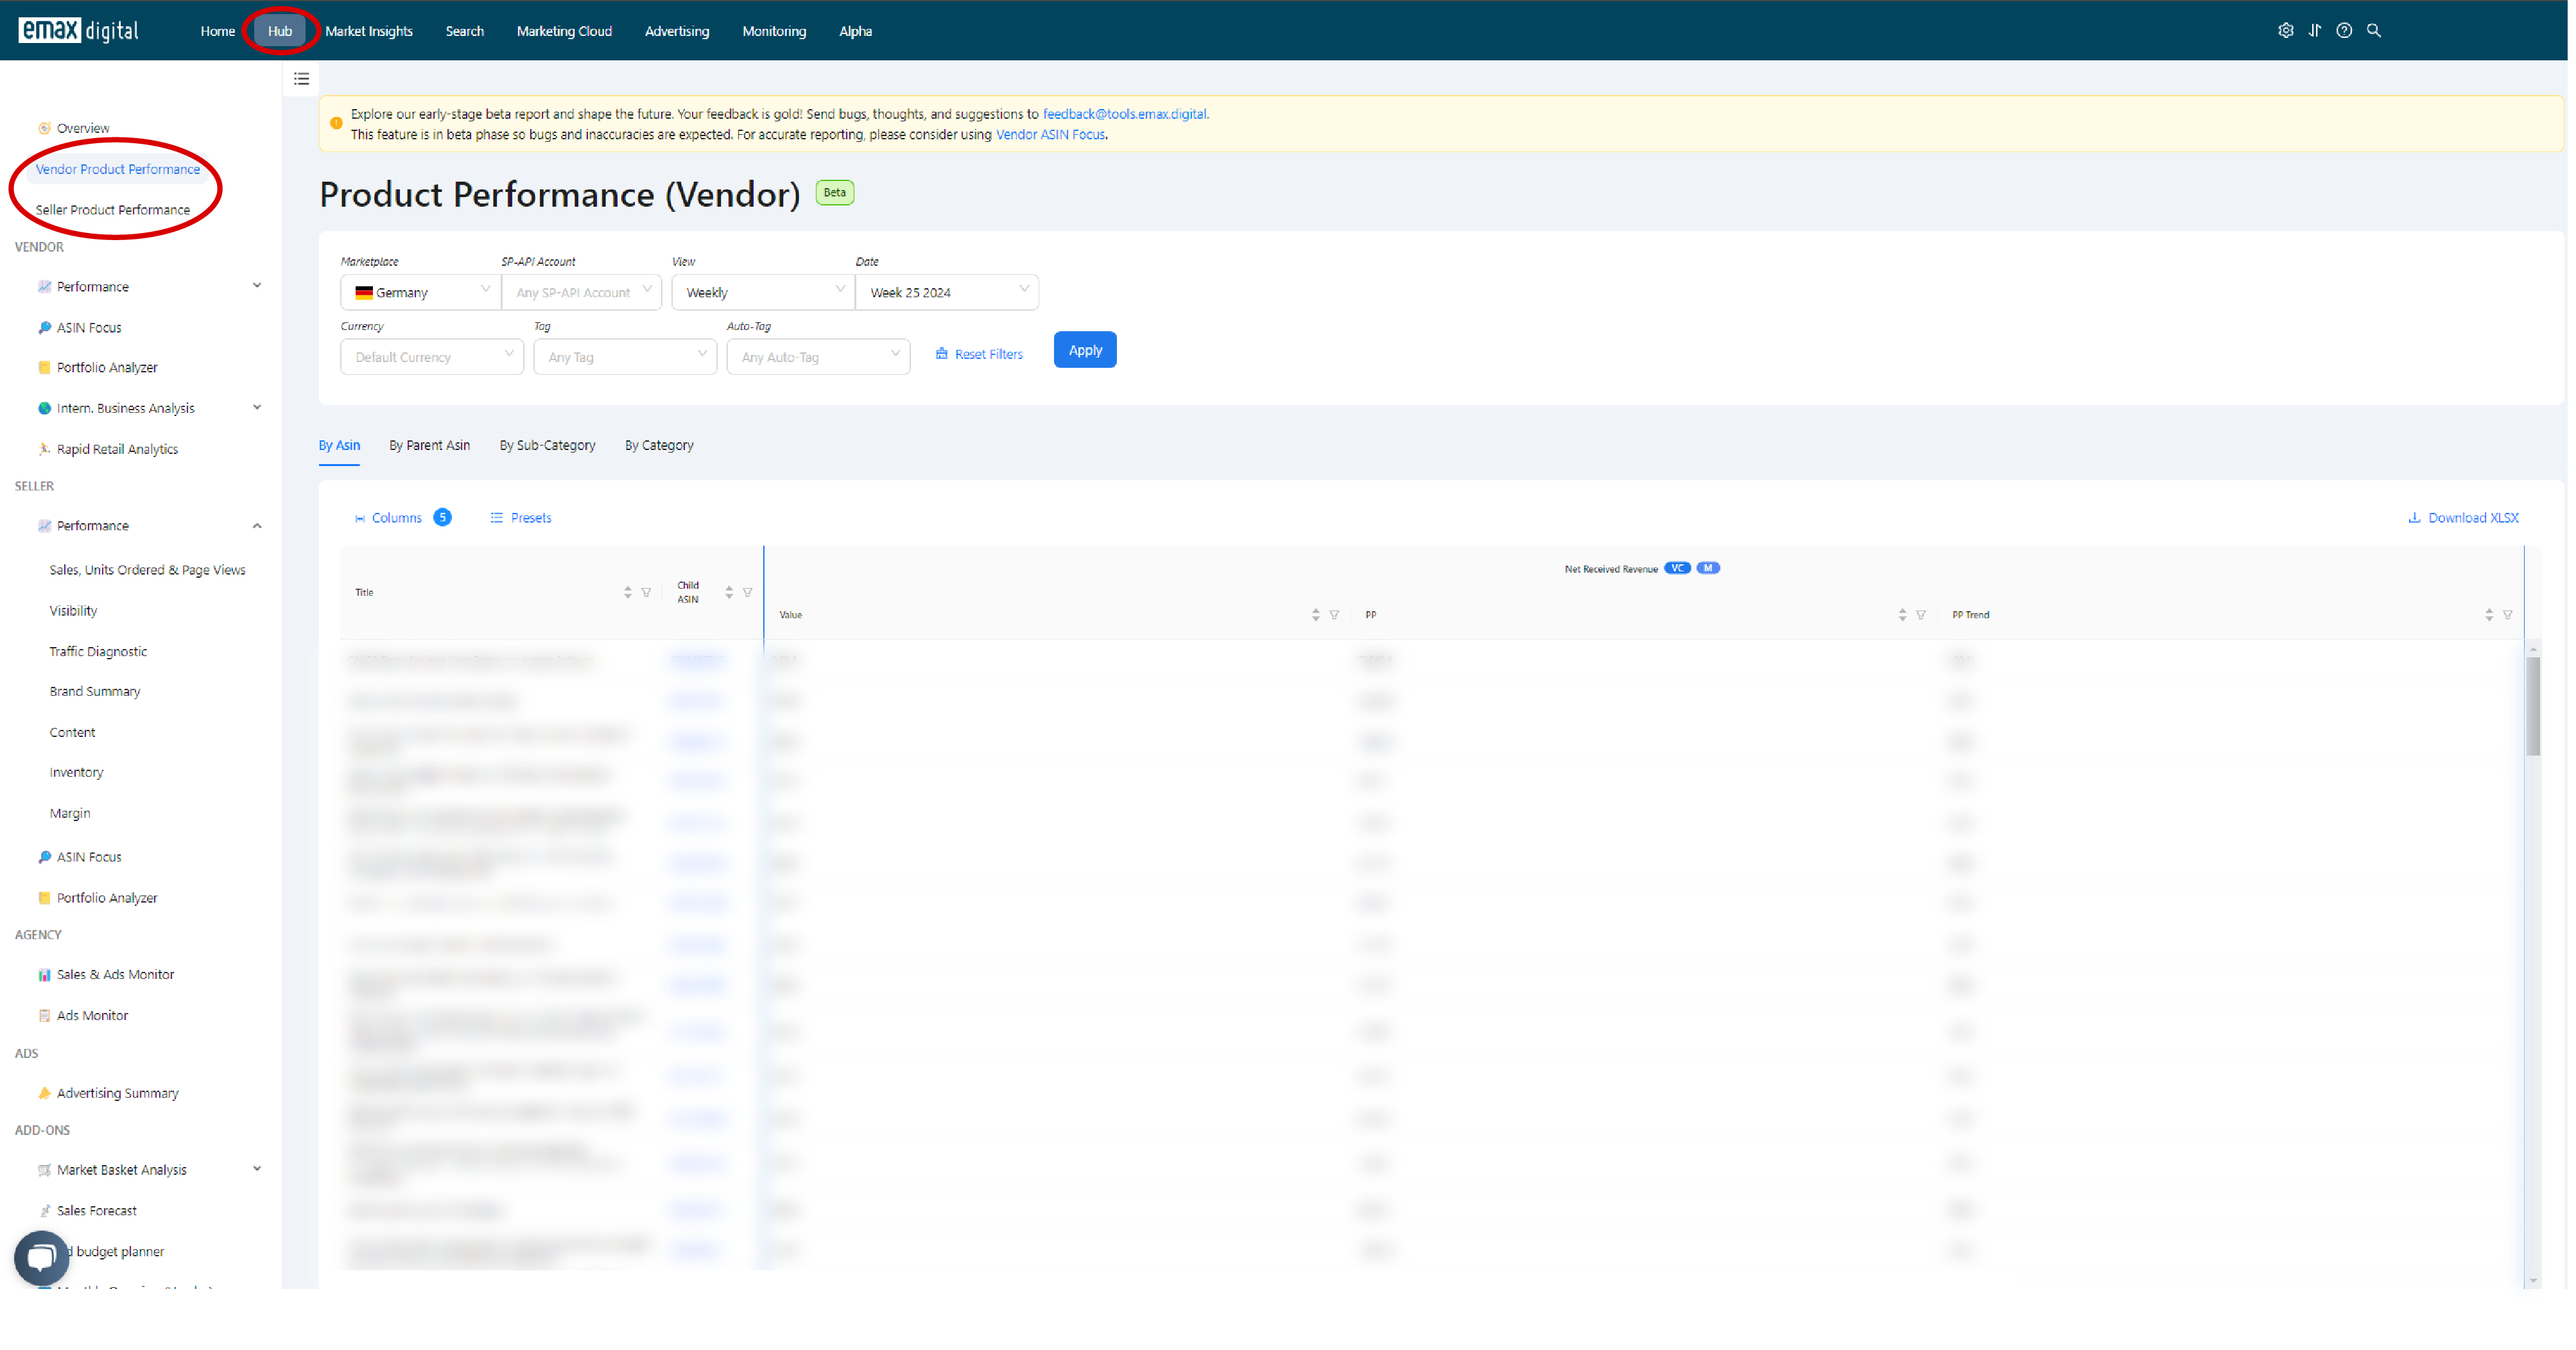
If your sales have dropped over the past week or a certain period and want to know which ASINs are responsible for that, you can use the Product Performance in our tool.
You can find the Product Performance in the Hub Section, for both Vendors and Sellers.
⚠️ External image — needs to be re-uploaded to Confluence

Source: https://knowledge.emax-digital.com/hs-fs/hubfs/Unbenannt-1-png.png
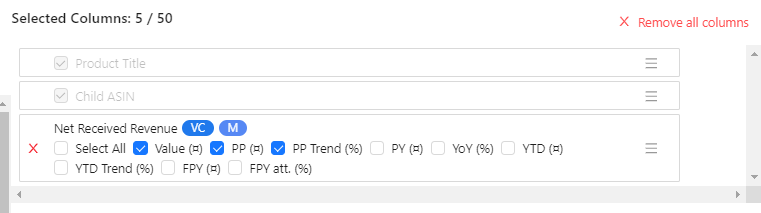
You can now select a certain time frame, either a week, month or year. Plus, you can choose your relevant KPIs in "Columns". For example, if you want to know wich ASINs are responsible for a decrease in revenue, we recommend you to choose your Net Received Revenue (Value, Previous Period and Trend).
⚠️ External image — needs to be re-uploaded to Confluence

Source: https://knowledge.emax-digital.com/hs-fs/hubfs/image-png-Jun-28-2024-08-52-45-7370-AM.png
In the chart below, you can now see which ASINs have the biggest minus trends.
For a more detailed Analysis, you can also include KPIs such as Ad Sales, Ordered Revenue, Ordered Units, Customer Returns, etc.
🏷️ Tags: keywords-visibility · how-to · asin · performance