
App path -> https://app.emax-digital.com/hub/vendor-chart-builder
The Chart Builder lets you build custom charts from your Vendor Central data — defining exactly which metrics to plot, over which time range, and at which level of granularity. Unlike fixed dashboards, the Chart Builder has no preset view: you choose the metrics, the grouping, and the comparison mode to answer the specific question you have.
Getting Started
When you open the Chart Builder, you'll see:
-
A filter panel on the right side where you configure your chart
-
4 KPI tiles at the top of the main view — showing summary values for the current selection
-
A chart area with three views you can switch between
Start by choosing a Comparison Mode, then configure the filters and click Apply Changes.
Comparison Modes
The Chart Builder has two modes — choose one based on whether you want to compare metrics or entities.
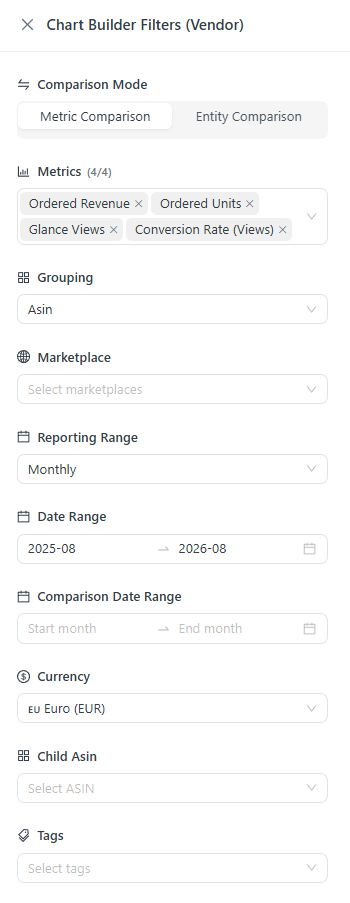
Metric Comparison
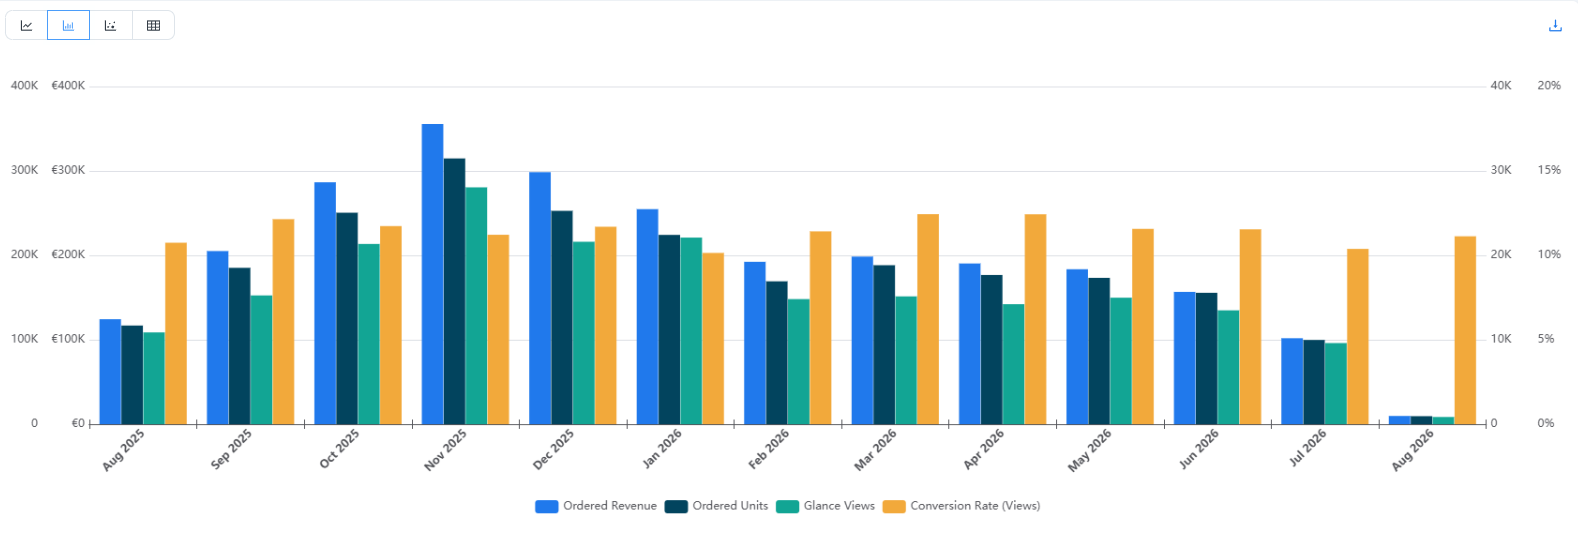
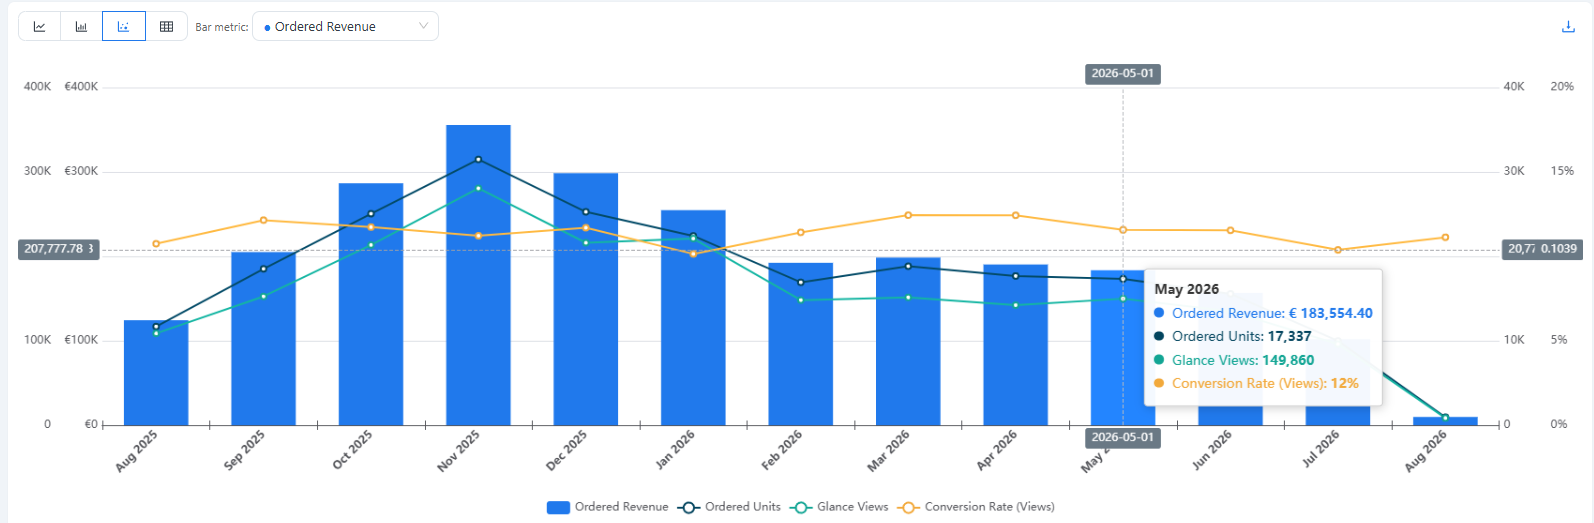
Plot up to 4 metrics simultaneously for a single grouping level. Use this to see how multiple KPIs move together over time — for example, whether a drop in Ordered Revenue is driven by falling Glance Views or a drop in Conversion Rate.
|
Filter |
Options |
|---|---|
|
Metrics |
Select up to 4 from: Ordered Revenue, Ordered Units, Glance Views, Conversion Rate (Views), and more |
|
Grouping |
ASIN, Category, Subcategory, Additional Parent ASIN |
|
Marketplace |
Multi-select |
|
Reporting Range |
Weekly, Monthly, Quarterly, Yearly |
|
Date Range |
Custom start and end month (e.g. 2025-08 → 2026-08) |
|
Comparison Date Range |
Optional second date range for period-over-period comparison |
|
Currency |
e.g. Euro (EUR) |
|
Child ASIN |
Filter to a specific Child ASIN |
|
Tags |
Filter by custom tag(s) |
|
Auto Tag |
Filter by system-generated tag(s) |
Entity Comparison
Plot a single metric across multiple entities simultaneously. Use this when you want to compare how different ASINs, categories, or subcategories perform against each other on one KPI — for example, Ordered Revenue for 4 ASINs side by side over the same period.
|
Filter |
Options |
|---|---|
|
Metric |
Select one metric |
|
Grouping |
ASIN, Category, Subcategory, Additional Parent ASIN |
|
Child ASIN |
Multi-select — select the entities to compare (shows count, e.g. 0/4) |
|
Marketplace, Reporting Range, Date Range, Currency, Tags, Auto Tag |
Same as Metric Comparison |
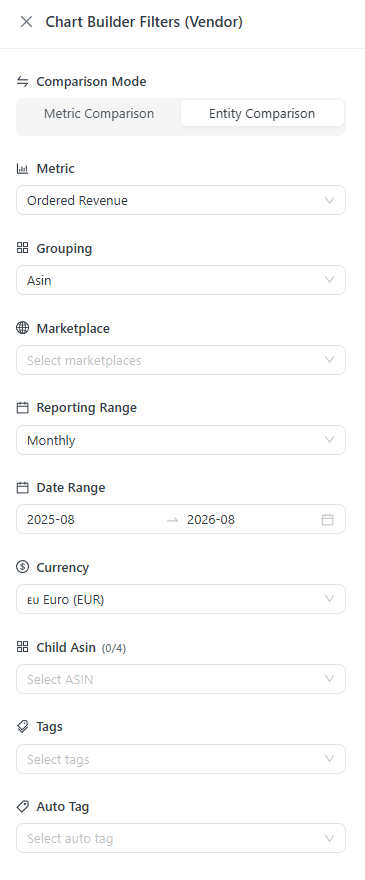
Chart Views
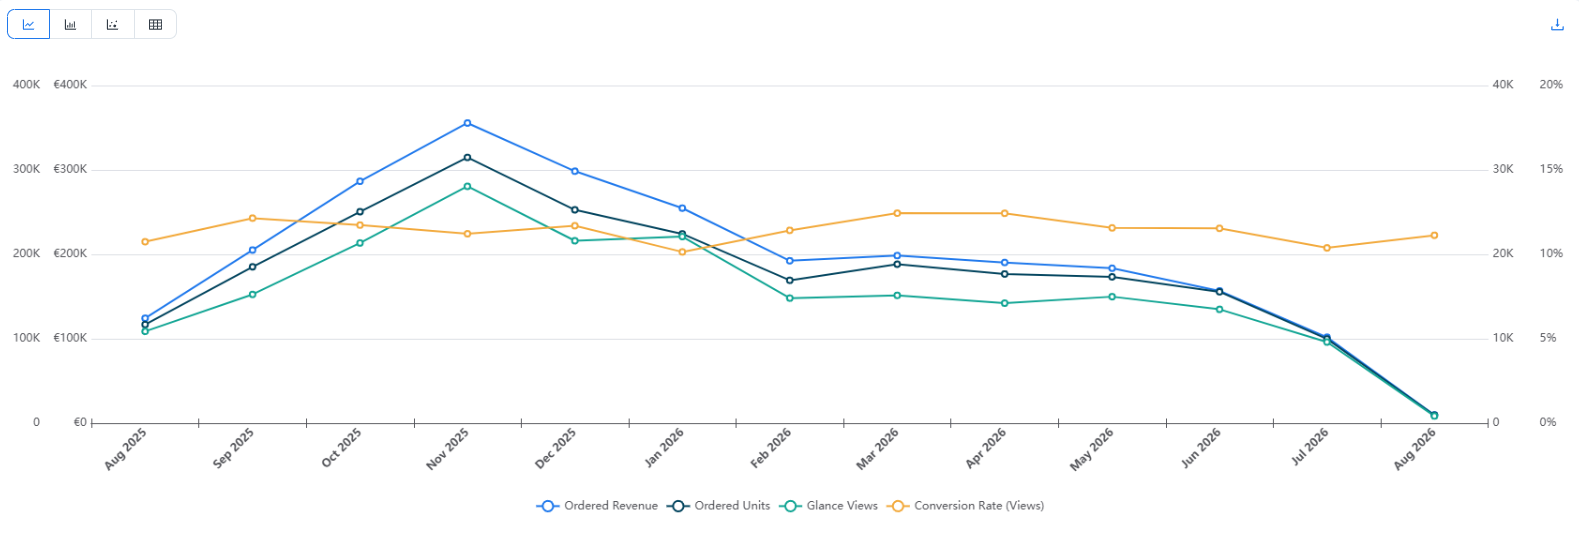
Once you apply your filters, the chart area offers three views — switch between them using the tabs:
|
View |
What it shows |
|---|---|
|
Chart |
Visual line or bar chart of your selected metrics or entities over the chosen date range |
|
Table |
Tabular / pivot view of the same data — useful for reading exact values and exporting |
|
List |
Flat list view of values per grouping item |
At the bottom of the chart, individual data series can be toggled on and off — useful when you want to focus on a subset of selected metrics or entities without re-applying filters.
Common Use Cases
-
Diagnose a revenue drop — Metric Comparison with Ordered Revenue + Glance Views + Conversion Rate, grouped by ASIN, over the affected months. See which metric is the leading driver.
-
Compare ASIN performance — Entity Comparison with Ordered Revenue, Child ASIN filter set to your top 4 products. See which is growing fastest or declining.
-
Year-over-year custom comparison — Set Date Range to the current period and Comparison Date Range to the same period last year for a side-by-side overlay.
-
Category trend analysis — Metric Comparison grouped by Category, Monthly, over 12 months. Spot which categories are gaining or losing share in your Vendor catalogue.
💡 Do you think the content on this page needs improvement? Let us know at support@emax-digital.com