
Dashboard link: https://app.emax-digital.com/product-performance-hub-seller
Overview
The Product Performance dashboard is the flexible, ASIN-level analysis workbench for your Seller Central business. It works much like a spreadsheet: you build custom columns tailored to your needs, sort and filter the data, and save your preferred views as presets for easy access. It is the dashboard to reach for whenever you want to understand which products are driving — or dragging — your performance, and why.
The dashboard only includes ASINs that are listed in your Amazon catalog. You can view data at four levels — ASIN, Parent ASIN, Sub-Category, and Category — so you can move between an operational, product-by-product view and a more strategic, portfolio-level view.

Filter Options
-
Marketplace — choose which marketplace's data you want to see for your selected date range.
-
SP-API Account — choose which account's advertising data you want to see.
-
View & Date — filter the time range and date you want to analyse.
-
Currency — choose the currency in which you would like to see your data.
-
Tag — select one or multiple tags for detailed analysis.
-
Category / Subcategory — apply category and subcategory filters to see how your defined groupings develop over time.
If you have multiple marketplaces, the Marketplace and SP-API Account filters show all marketplaces by default in the table when no marketplace is chosen.
KPIs
In this extensive dashboard you can track critical KPIs such as Bestseller Rank, Sellable Inventory, Conversion Rate, Shipped Revenue, Ad Sales, Click-Throughs, and Procurable Product Out-of-Stock Rate. You can filter data by manufacturing or sourcing level and choose your preferred attribution window for review, for a tailored analysis.
Because Product Performance brings sales, traffic, conversion, advertising, content, stock, Buy Box, and sales-rank signals together at ASIN level, it is the single place to investigate an ASIN end-to-end. The following sales-influencing KPIs are particularly useful when diagnosing an individual product:
-
Ordered Revenue Trend — sort to surface the ASINs with the most negative trend first.
-
Traffic / Glance Views — identify ASINs losing traffic.
-
Conversion Rate — organic and paid.
-
Content Score, Variations, Buy Box, Sales Rank, Ad Spend, Stock, Price, Ratings — the levers behind a sales or traffic change.
-
Company Margin (ASIN level) — available once you have maintained fixed and variable costs in your catalog; shows how much room you have left to spend on advertising while staying profitable.
A note on ASIN-level deep dives: the dedicated "ASIN Focus" dashboard has been retired. All of its ASIN-level metrics — organic vs. paid sales split, TACoS/ACoS development, conversion-rate split, sessions, and Buy Box — now live here in Product Performance, where you can build the same views with custom columns and the four view levels.
View Options
You can view data at four different levels — ASIN, Parent ASIN, Sub-Category, and Category — allowing you to focus on specific identifiers for a comprehensive analysis.
Getting Started
1. Create your custom table
Select the metrics and KPIs you want to include and customise the layout — arranging columns to display the data most effectively.

2. Explore multi-country insights
Use the multi-country overview to understand your performance on a global scale and compare data across regions to identify patterns and areas for improvement.


3. Use sorting and filtering
Arrange your data to focus on specific criteria and narrow down your view to extract meaningful insight — just like in a spreadsheet.

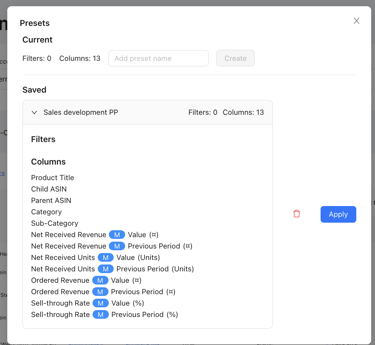
4. Save your custom table (presets)
Once you have configured the dashboard to your liking, save your custom views for future reference so you can access your preferred settings whenever you need them.
Use Cases
Sales performance is dropping or not growing month-over-month
Select your sales data, traffic, conversion rate, in-stock, Buy Box, and sales rank to understand which factor could be causing the sales drop. Compare against previous-year data (the same timeframe last year — e.g. April 2024 vs. April 2023) to check whether the drop reflects a low season or is unusual.

Understand which categories or subcategories are performing well or badly
Select your sales KPIs and analyse the numbers against your benchmarks. To find underperforming ASINs, use the filter options and select ASINs below your benchmarks.

To analyse performance at category or subcategory level, make sure you have filled in those details in your emax digital catalog. If you have not done so yet, learn how to complete your Seller Central Catalog.
Migration note (Phase 1b): Written from the legacy Seller Analytics pages "Product Performance Seller" (1667170416) and "Seller ASIN Focus Walkthrough" (1665761401). The ASIN Focus dashboard is deprecated; its metrics have been folded into this page. Content reproduced, not yet optimised or fact-checked. Eight source images embedded via external HubSpot URLs — intern to verify they render and re-upload if broken. Internal links to be confirmed in the redirect/relink pass.